BEAST tutorial
This tutorial shows how to explore an image collection in the BEAST demo and how to label what you find. For the ideas behind the tool, read the overview.
Before you start
You need a username and password. We hand them out at the conference, and you can request them in our first survey.
About the demo
- Data: Images from the ZooScanNet dataset, taken from the Planktonzilla dataset together with the classes that Planktonzilla proposes for them.
- Model: DINOv3 ViT-B/16. It was trained on natural images, not on plankton, but it also gives strong embeddings for plankton images. The model turns each image into an embedding.
- Map: UMAP. Each point is one image, and similar images lie close together. Short distances on the map are reliable. Long distances, for example between two clusters, do not carry information.
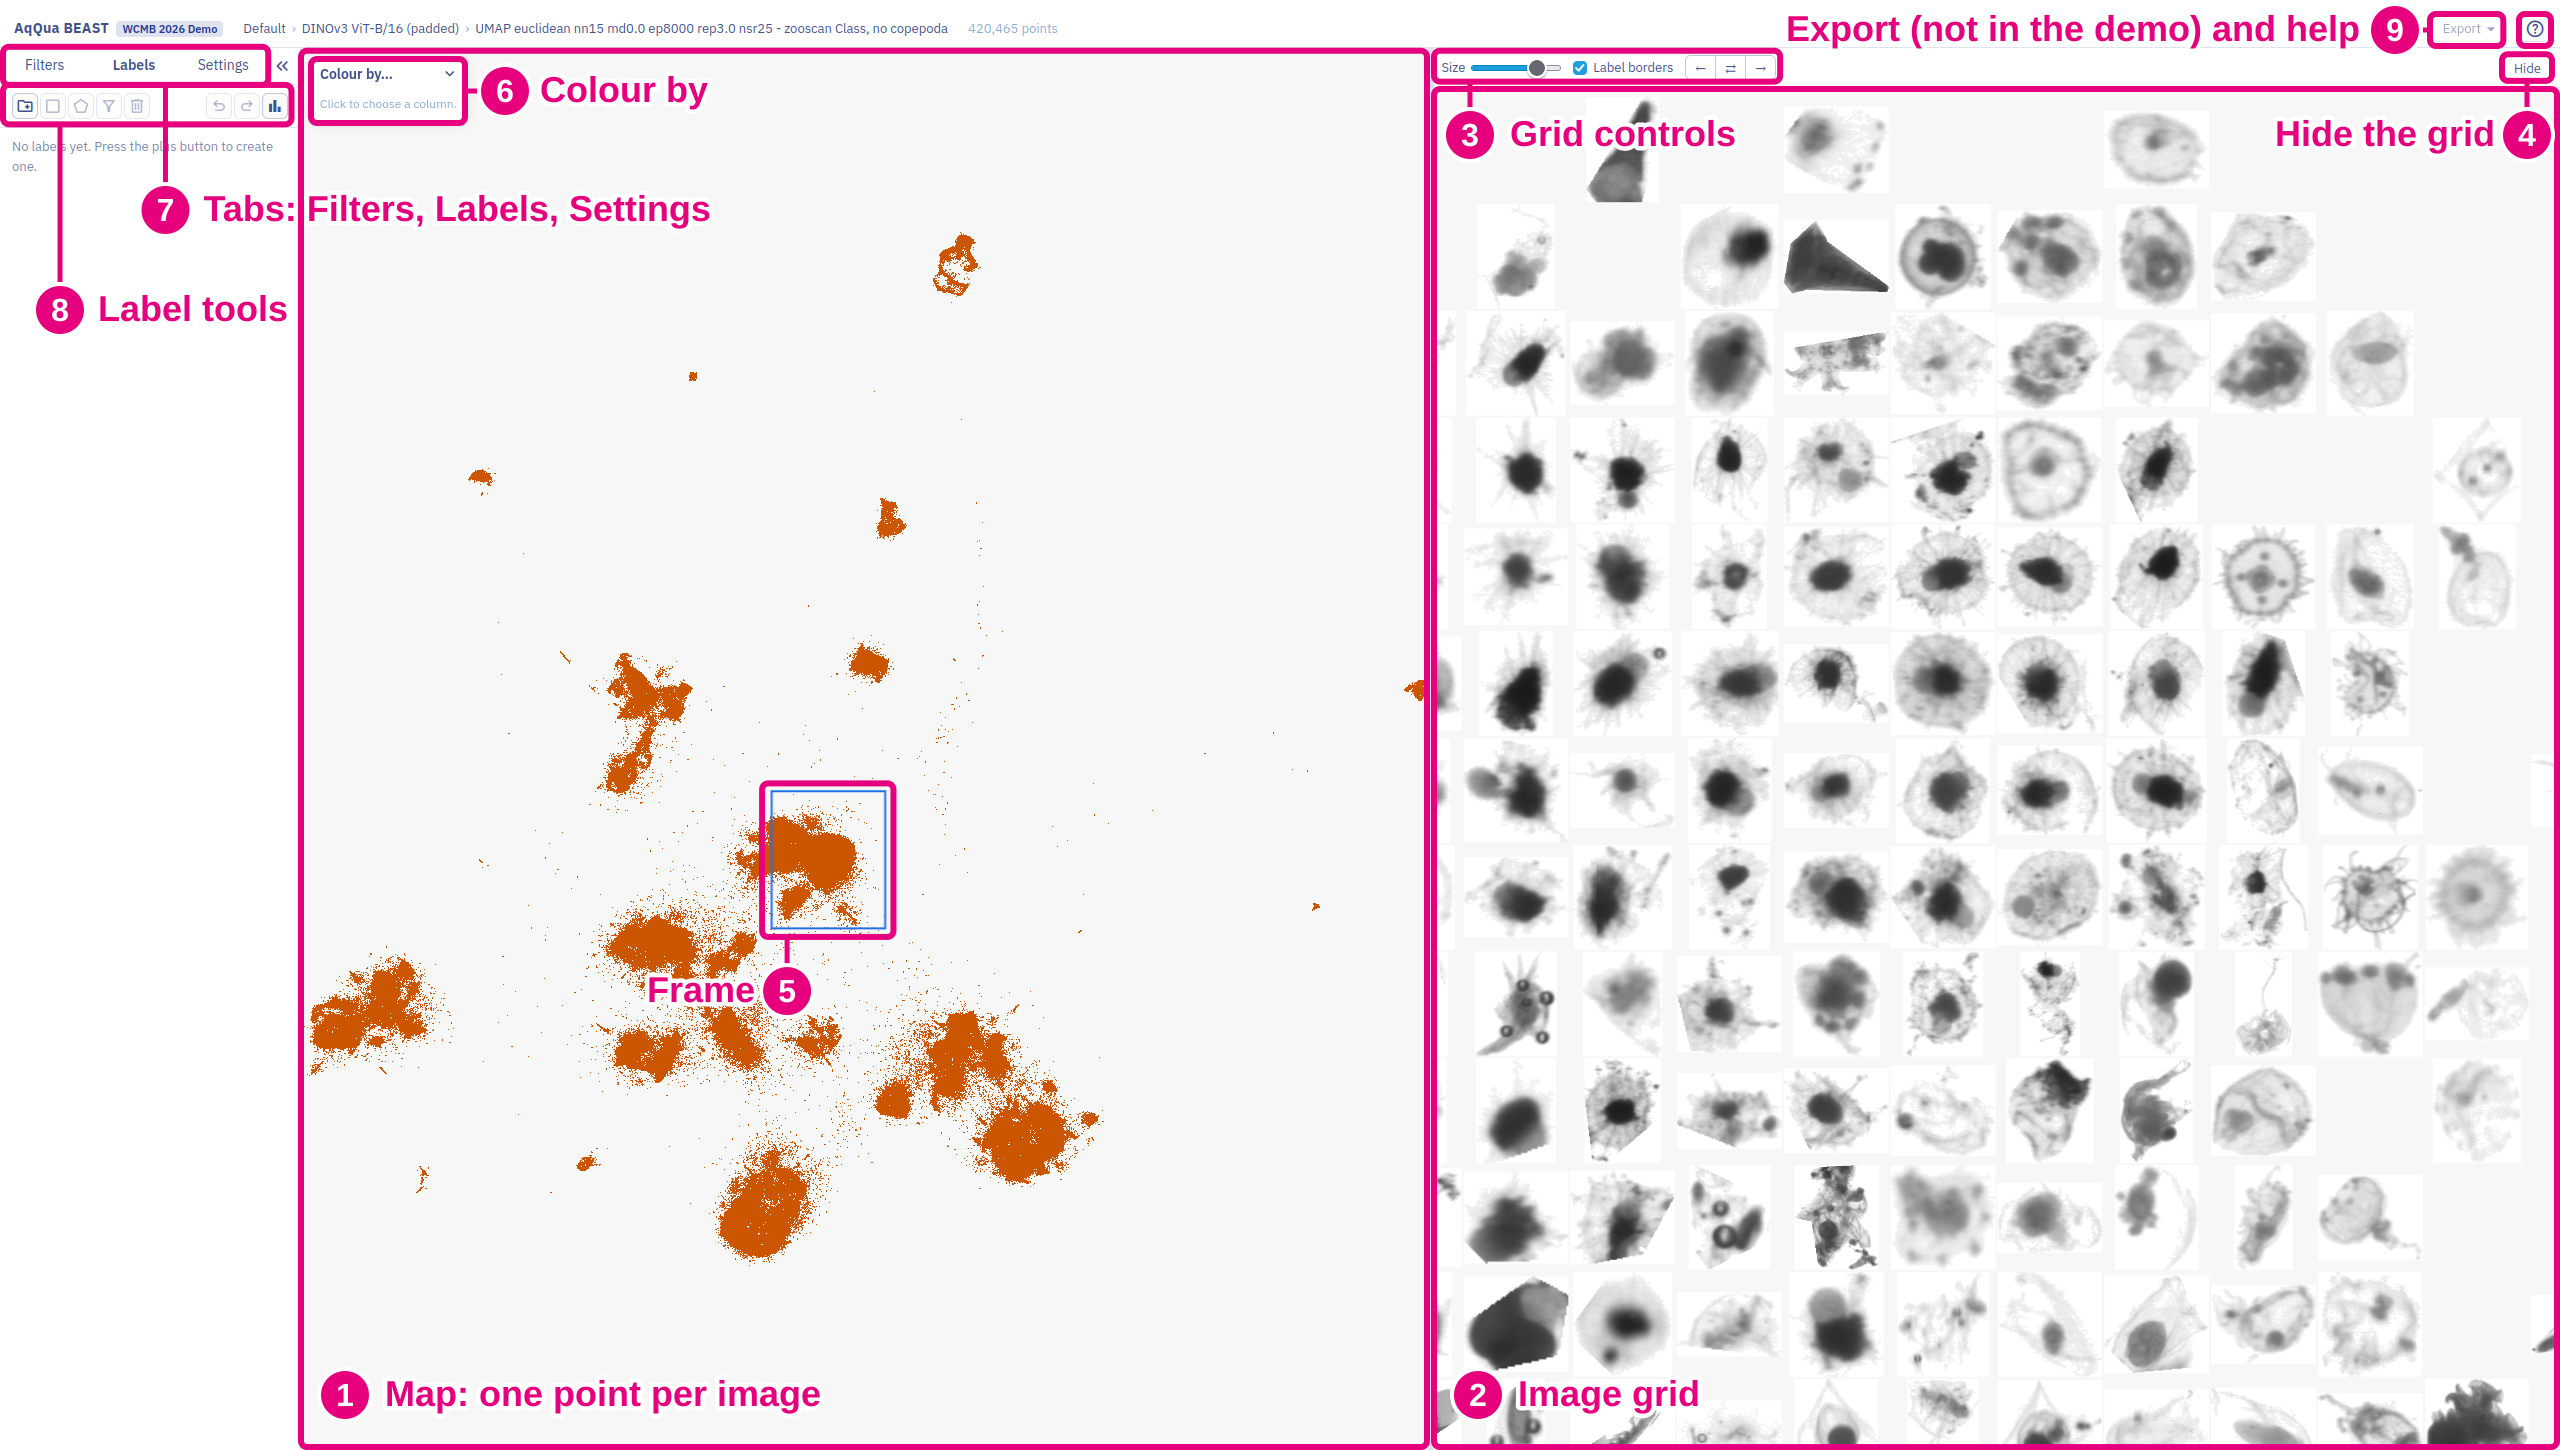
The export (9) is disabled in the demo. Later it will offer deeplinks and the option to save the labels back to the underlying data.
Move across the map
The map (1) and the image grid (2) can be panned and zoomed independently by dragging the mouse and using the mouse wheel.
Additional grid controls (3) are available to adjust the image grid:
- Size changes the size of the grid cells, and with them the size of the images.
- ← and → match the region of the map to that of the image grid, and the other way round. ⇄ links both views, so they pan and zoom together.
- Hide (4) hides and restores the image grid.
- A frame (5) on the map shows the region that the image grid covers.
Examine the images
Click a point or an image. A card shows the image, its data and the labels assigned to the image.
Colour the points
In the legend, Colour by (6) selects the column that colours the points, for example the proposed labels or the geolocation.
- For a column with categories, the legend can hide single categories. A column often has more categories than the palette has colours. In this case, you can mix the colours randomly.
- For a column with numbers, you can change the range of the colour bar.
Settings to adjust the plot can be made in the Settings tab towards the left.
Filter by metadata
The Filters tab (7) hides the points that do not match your filter.
In the legend, Copy as filter copies the shown categories as a filter. Copy range as filter copies the colour range. Paste the filter in the Filters tab or in a label.
Label a region
- Open the Labels tab (7) and make a new label with the label tools (8).
- Choose the box or the polygon tool and draw around points on the map to select them.
- To cut a hole in a label, for example to make a donut shape, select Negative selections in the label before you draw.
- To keep only matching images in a label, for example by geolocation or depth, add a filter to the label.
You can copy and paste labels, selections and filters using ctrl+c and ctrl+v.
You can also show per-label sample images and statistics.